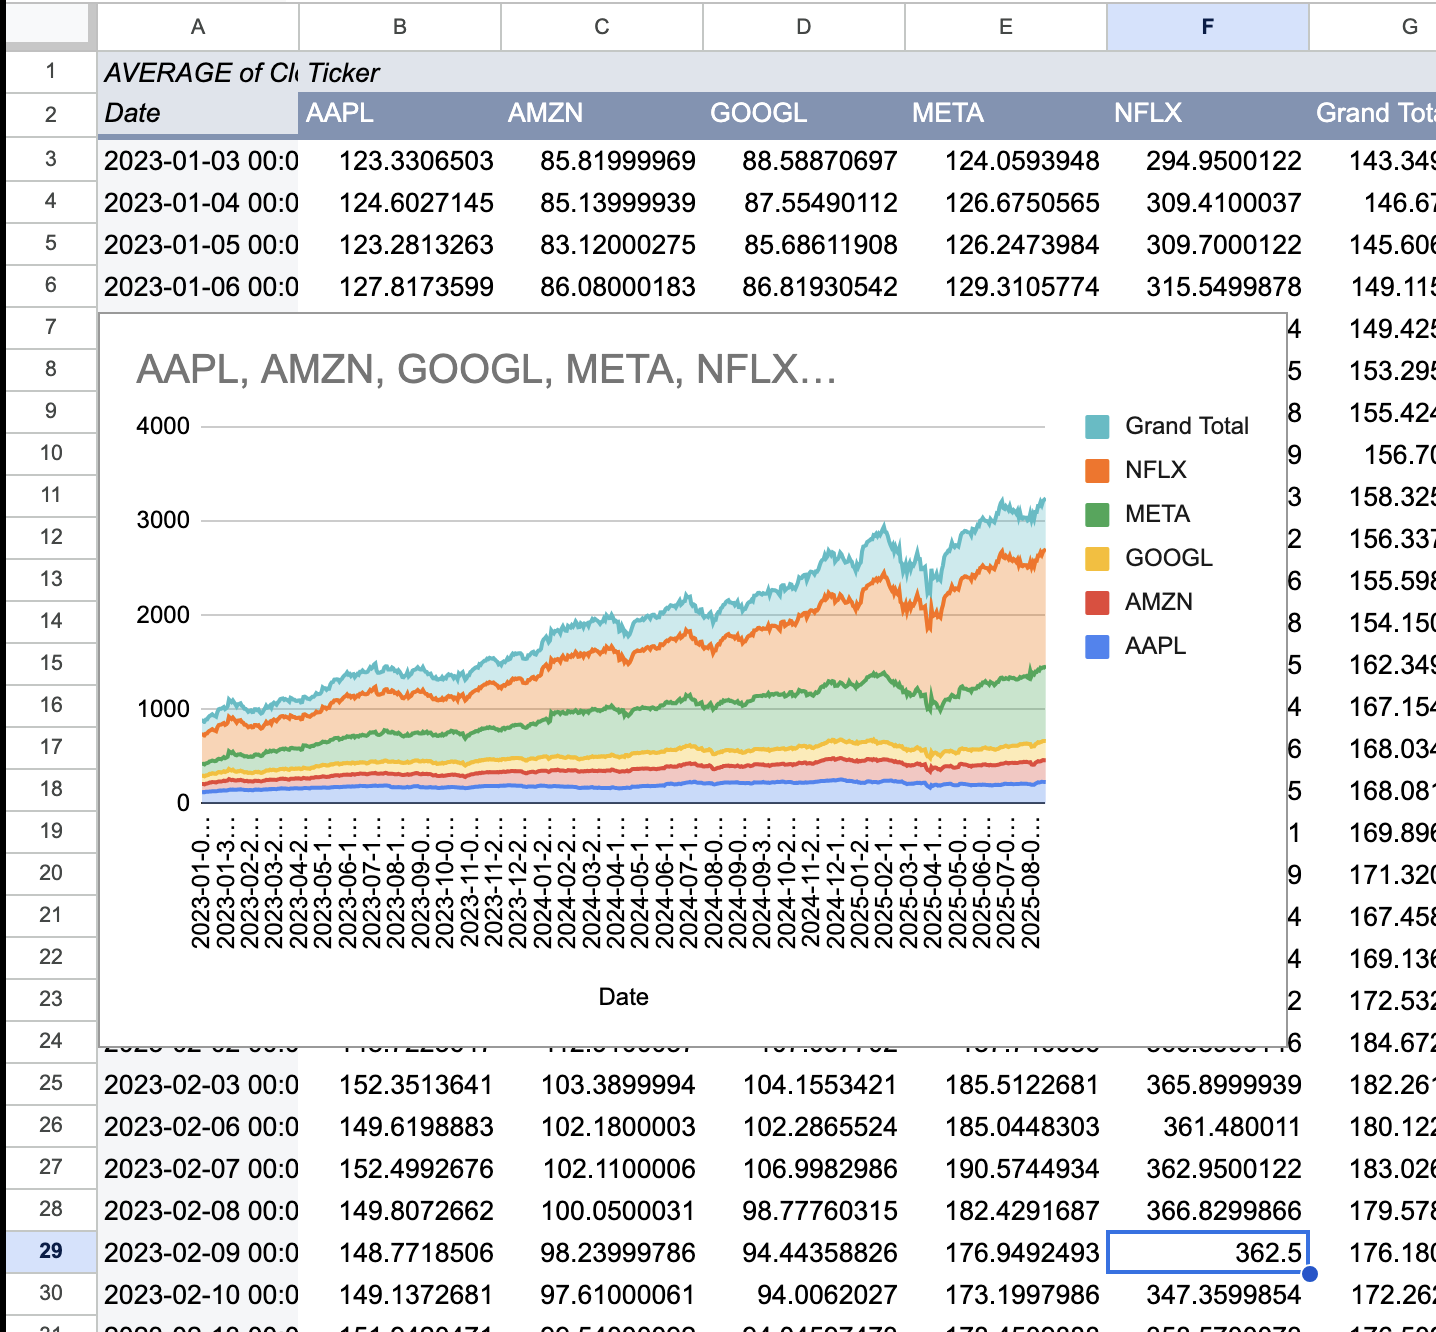
Average Price Pivot
Displays the average closing price of each MAANG stock over time, calculated via avg(closing) price.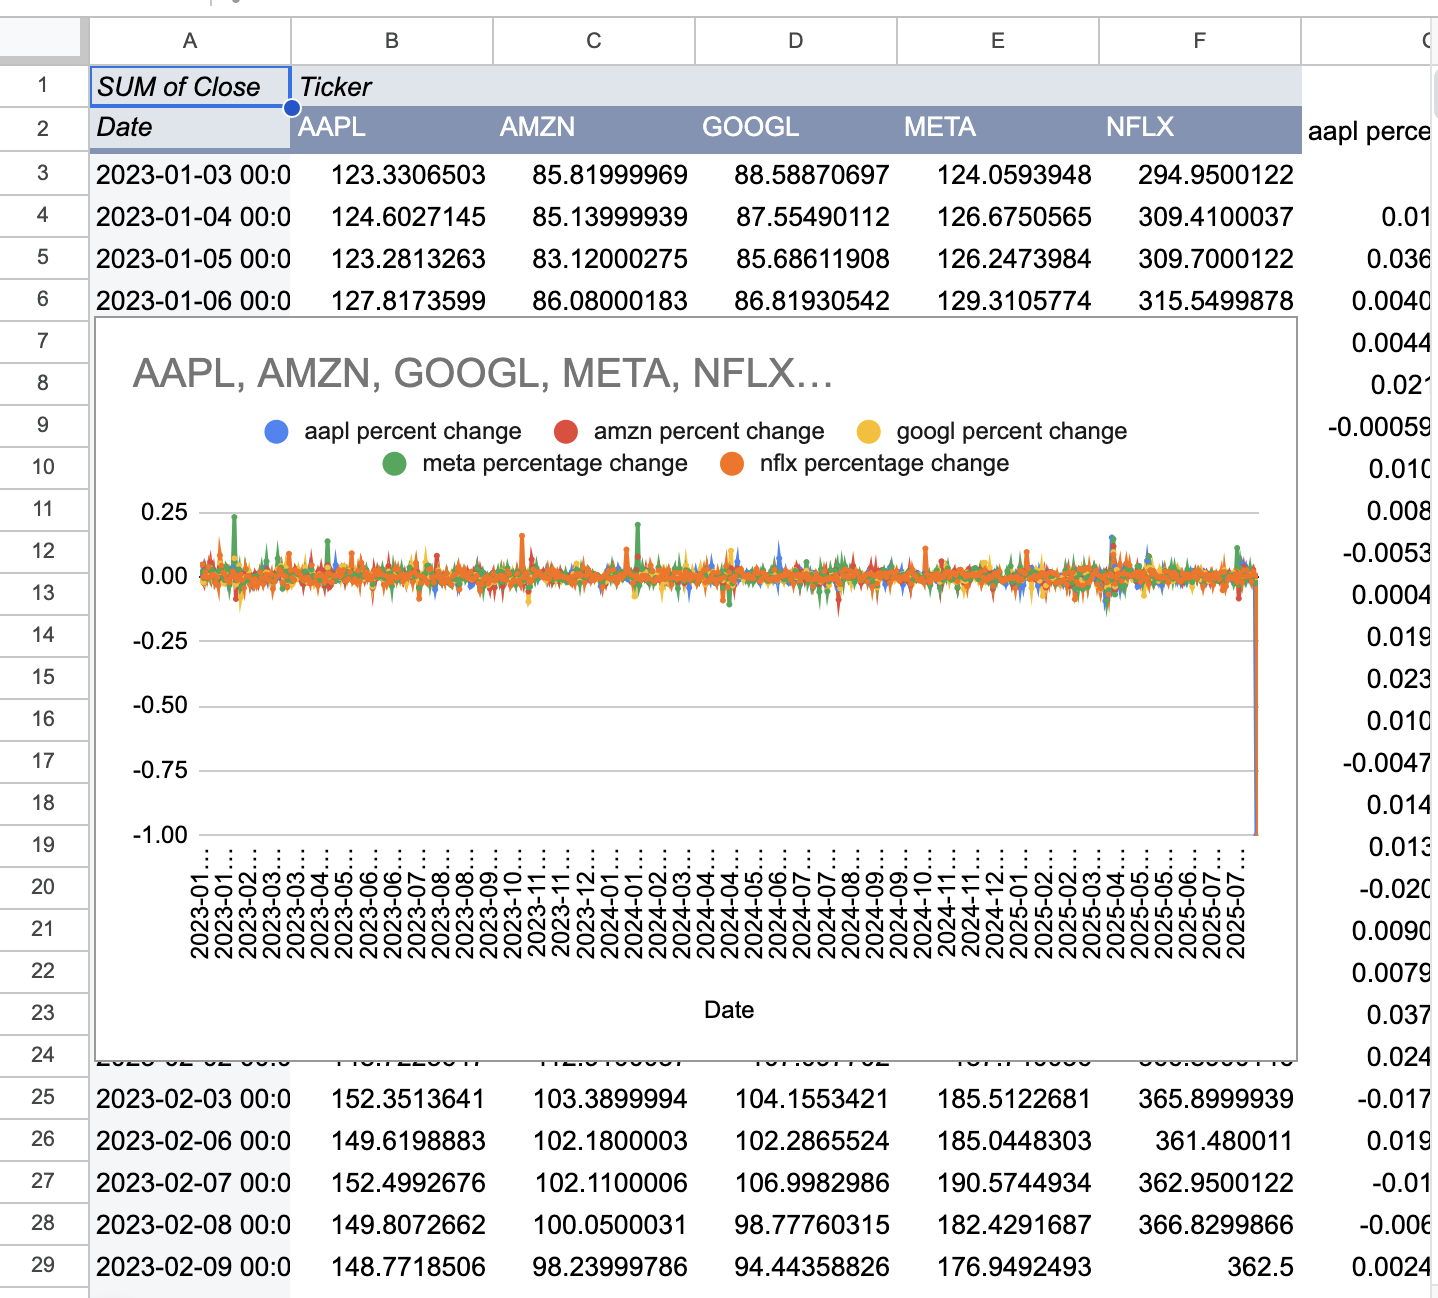
Volume Pivot
Visualizes daily trading volume per stock to highlight periods of heightened market activity.
Average Price Pivot
Displays the average closing price of each MAANG stock over time, calculated via avg(closing) price.
Volume Pivot
Visualizes daily trading volume per stock to highlight periods of heightened market activity.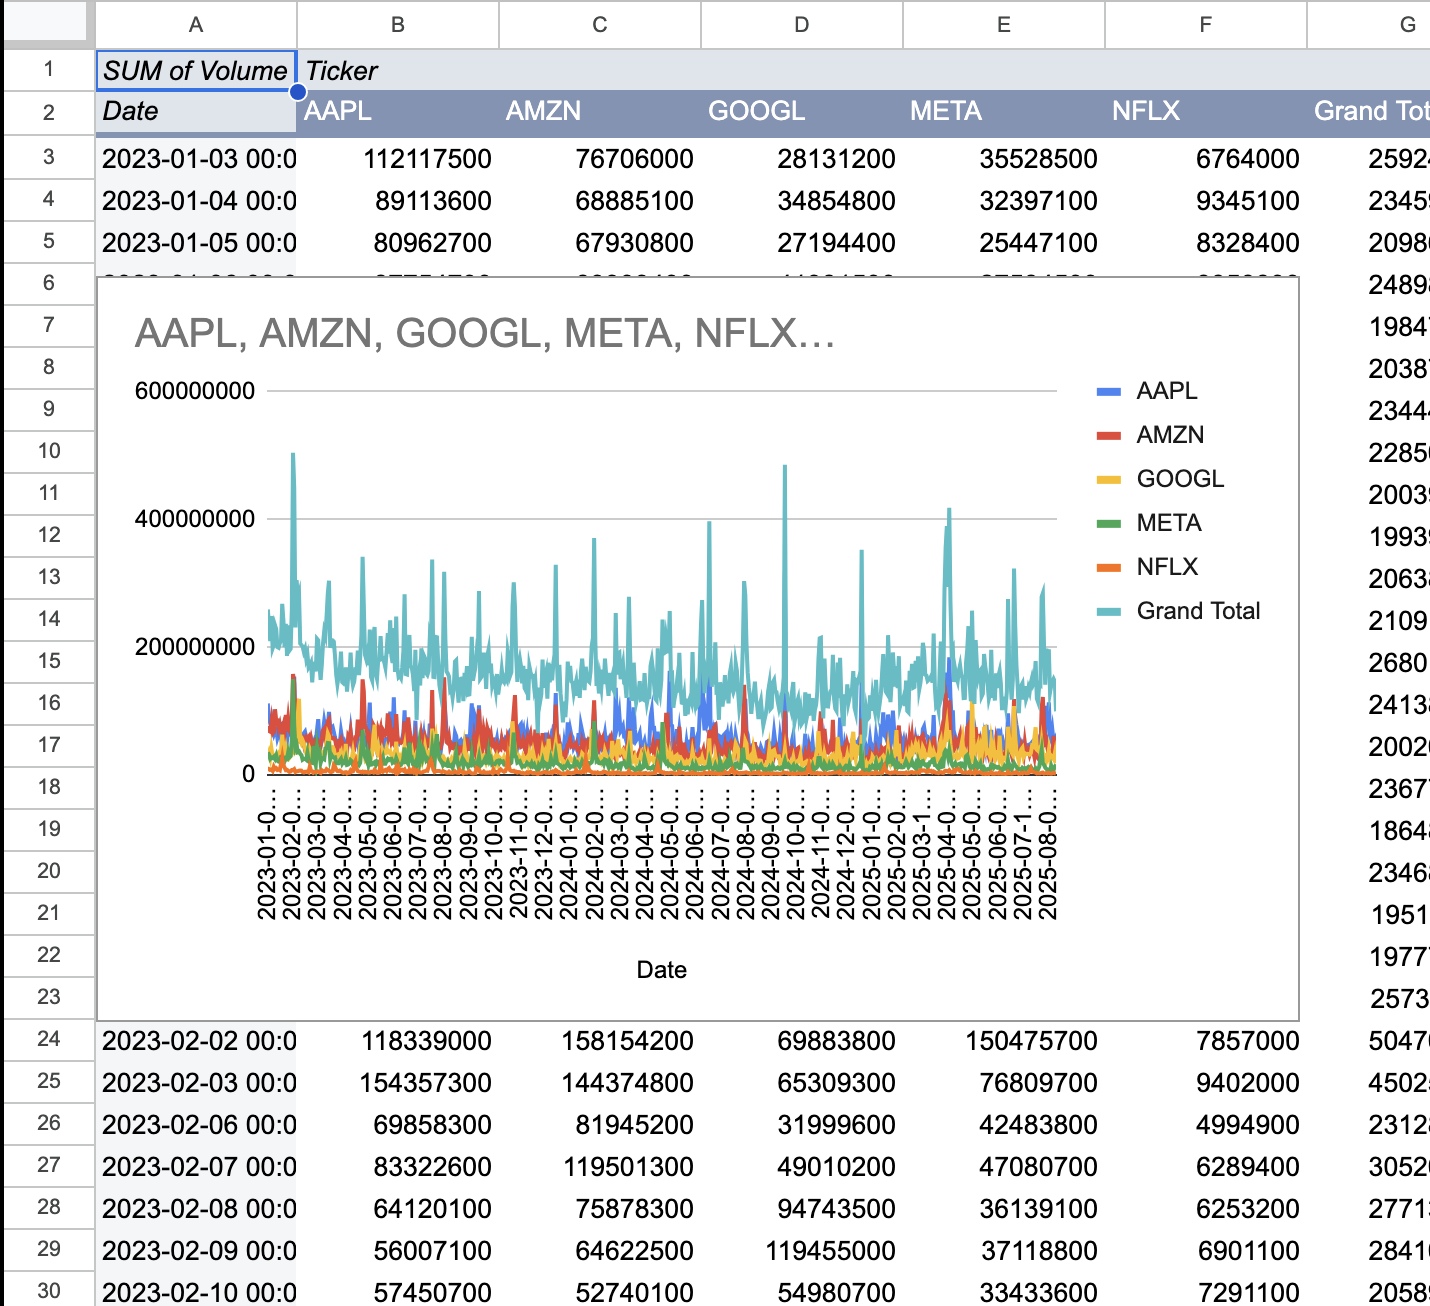
Percentage Change Pivot
Shows daily percentage changes in stock prices. Calculated by fx = (C3 - C2) / C2