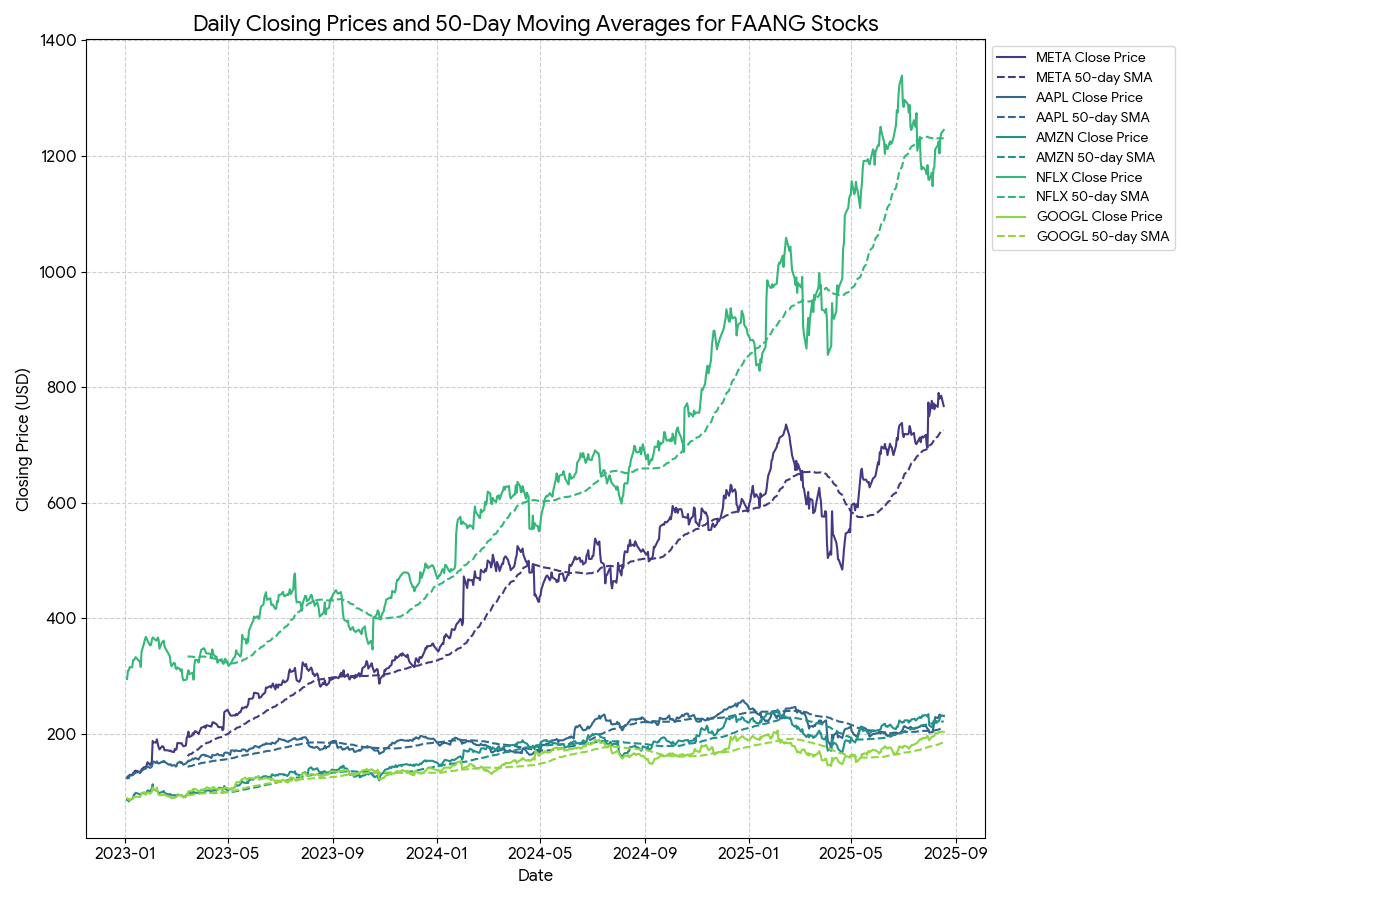
Gemini Averages
Displays the 50-day Simple Moving Average (SMA) and daily closing prices for each FAANG stock, highlighting long-term price trends.
Gemini Averages
Displays the 50-day Simple Moving Average (SMA) and daily closing prices for each FAANG stock, highlighting long-term price trends.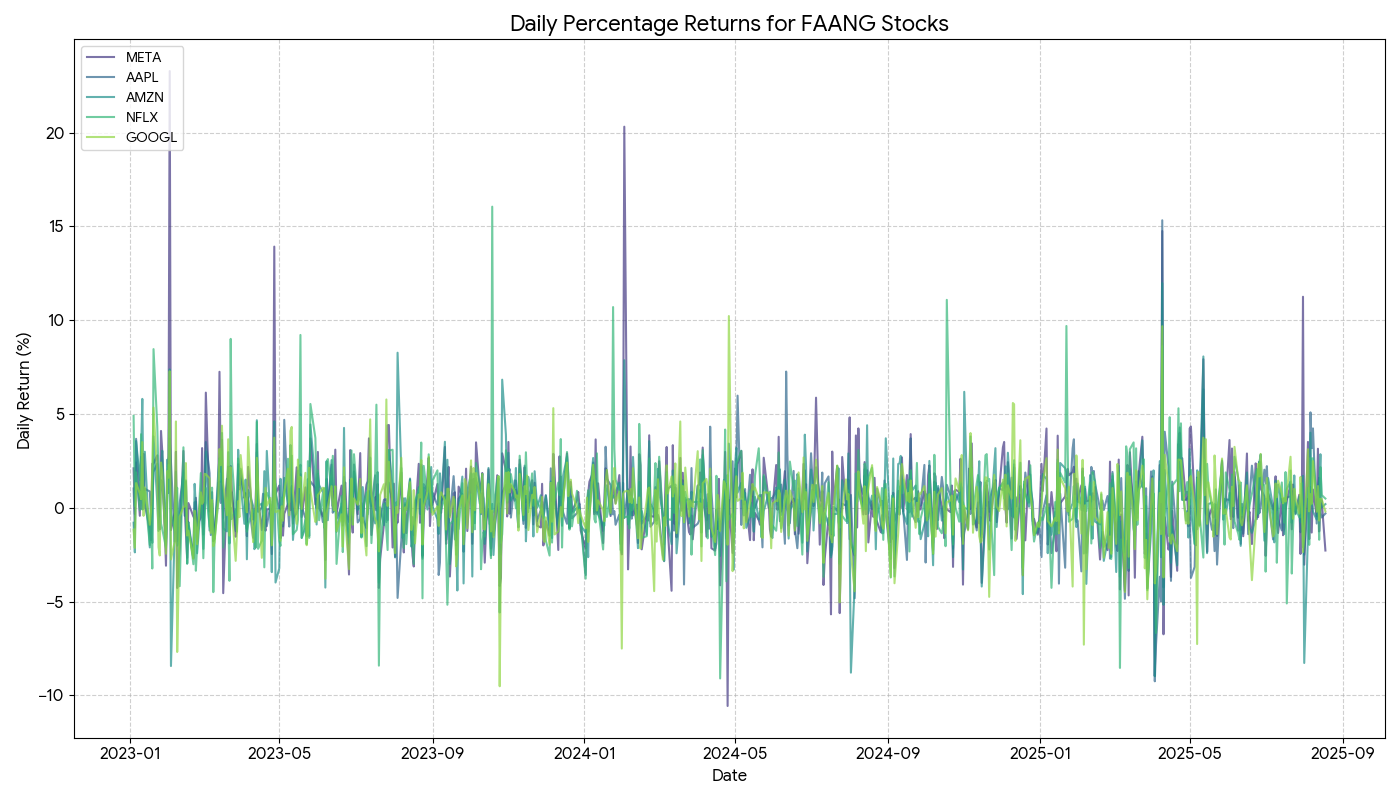
Gemini Daily Percentage Returns
Shows the daily percentage return for each ticker, offering insight into short-term price volatility and momentum.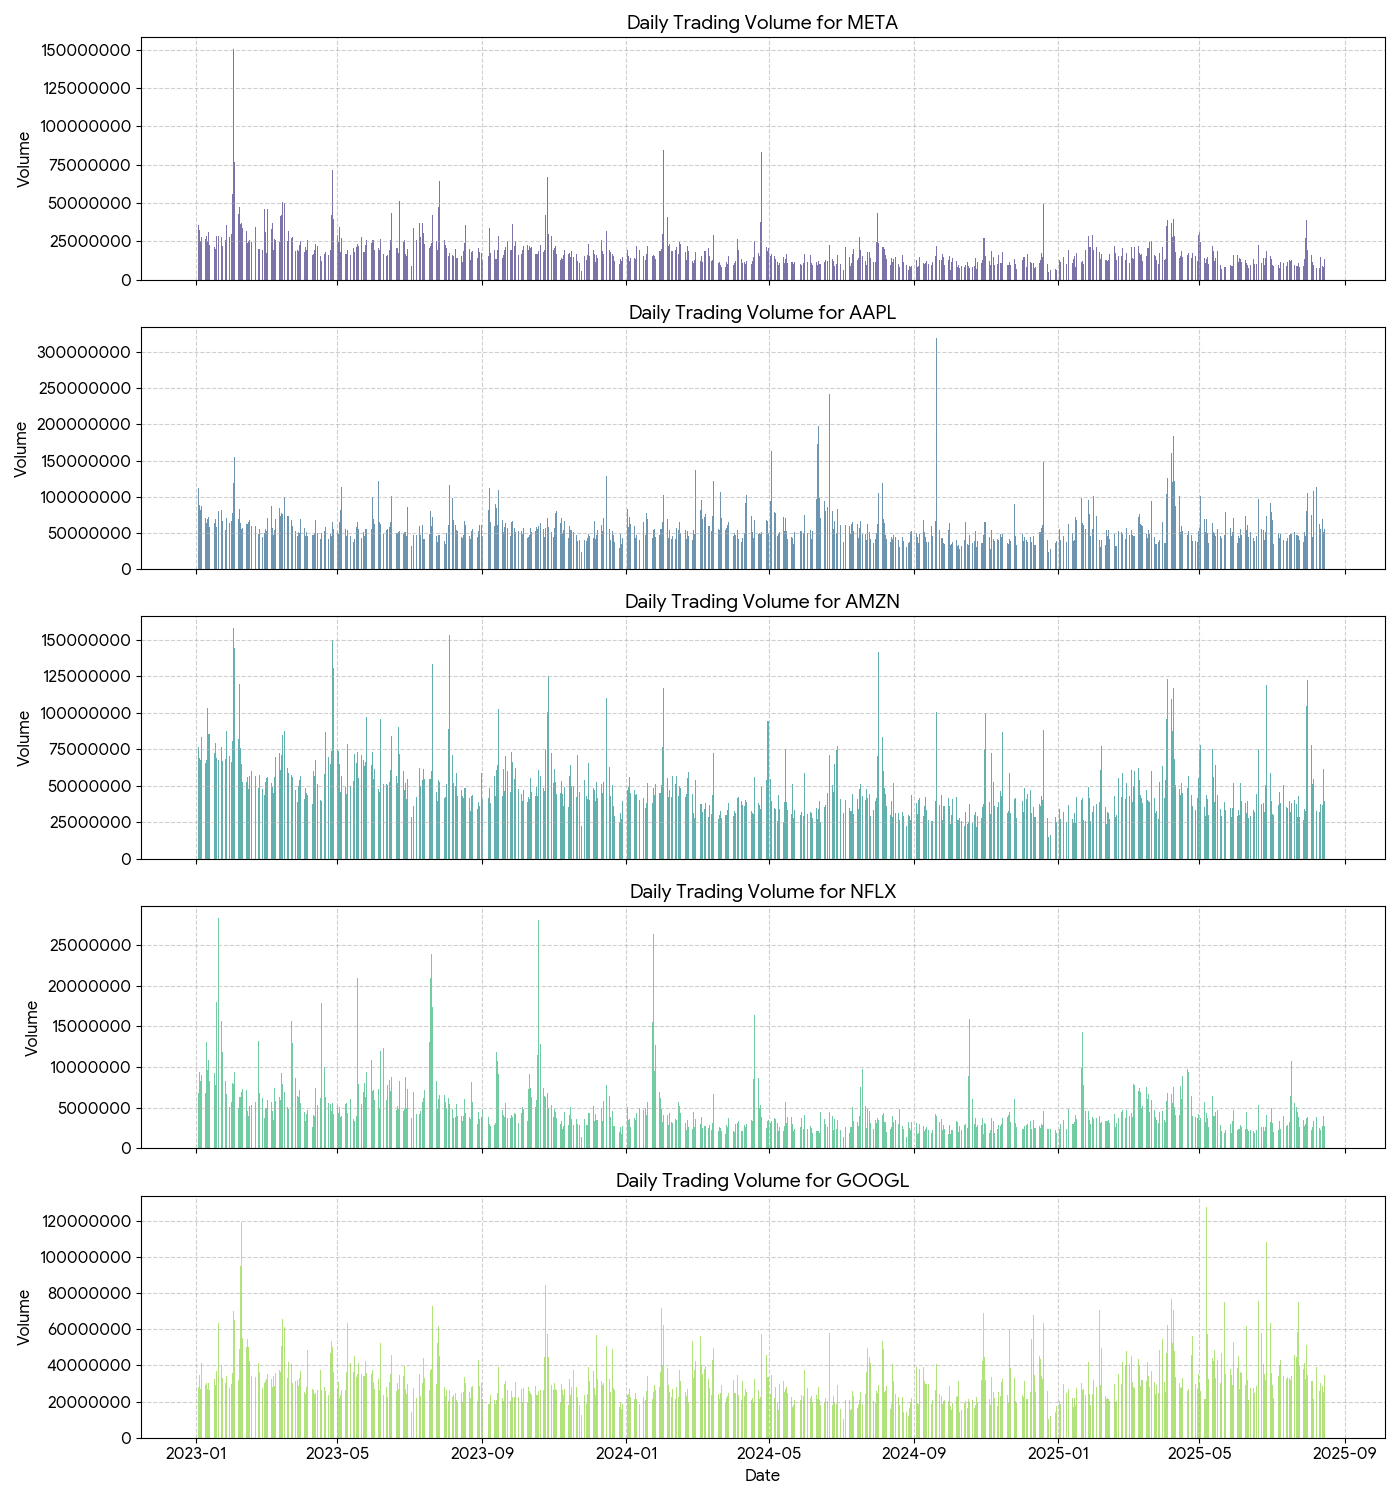
Gemini Daily Trading Volumes
Visualizes the daily trading volume for each FAANG stock, helping identify periods of high market activity and investor interest.